Student Achievement Goals, Measures, and Performance Data
▓▌▌«╔ńŪ° (EMU) is a small, liberal arts college with a mission to ŌĆ£prepare students to serve and lead in a global context.ŌĆØ In compliance with the Southern Association of Colleges and Schools Commission on Colleges, EMU evaluates success with respect to student achievement using the following metrics:
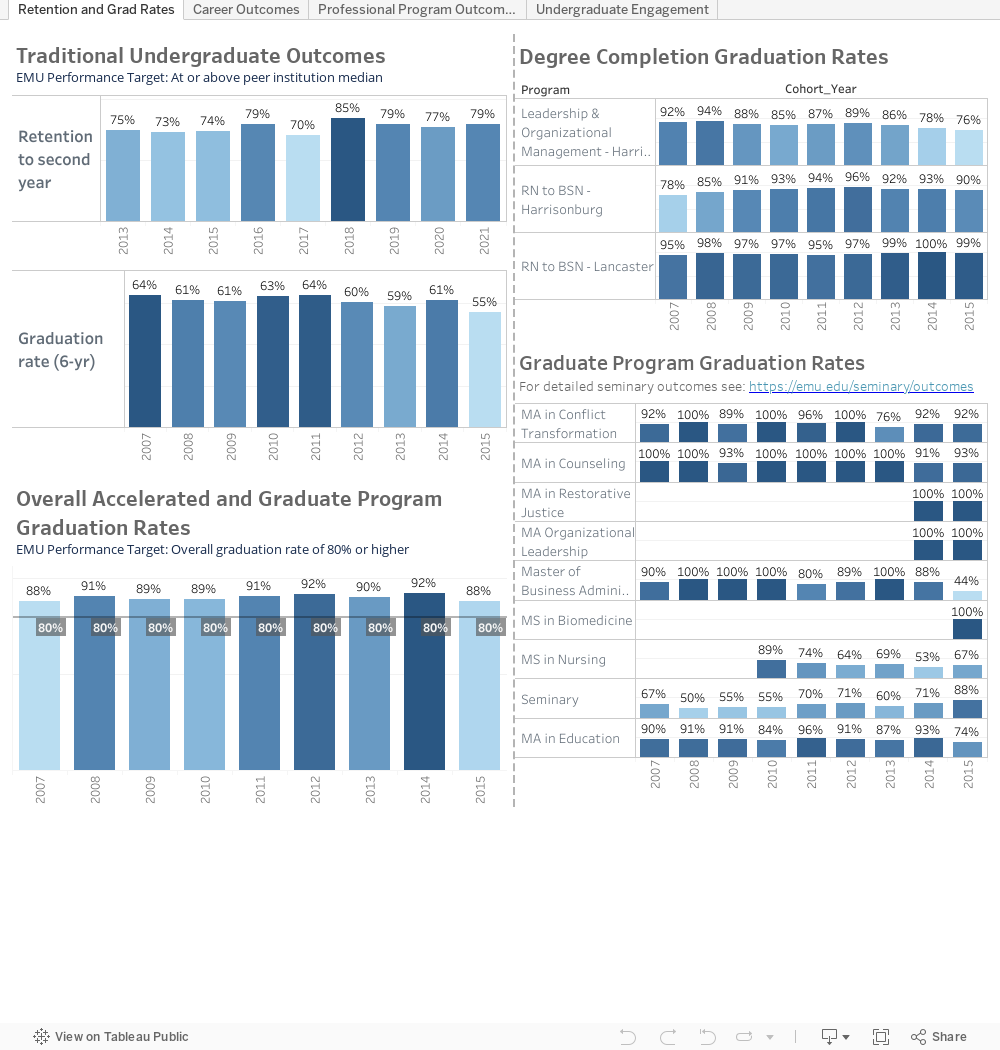
- Retention rate (undergraduate)
- Graduation rates (undergraduate and graduate)
- Employment rate (undergraduate)
- Licensure exam pass rate (education and nursing)
Retention rates
Student population: first-time undergraduate students
Target: at or above peer institution median
This metric is the percentage of fall first-time in college undergraduate students (FTIC) that continue their studies at EMU in the fall semester of their second year. Our formal institutional goal is to meet or exceed the median retention rate of our identified set of 19 peer institutions. Additionally, we monitor the retention rates of key groups of students based on demographic characteristics in order to target support and initiatives that enhance student success.
Cohort Year |
Peer Median Retention |
EMU FTIC Retention |
| 2018 | 72% | 85% |
| 2019 | 76% | 79% |
| 2020 | 72% | 77% |
| 2021 | 72% | 79% |
| 2022 | 71% | 76% |
| 2023 | 70% | 76% |
| 2024 | * | 74% |
*data not yet available
Graduation rates
Student population: degree-seeking students at all levels
Targets: at or above peer institution median for traditional undergraduates; 80% overall completion rate for graduate and non-traditional undergraduate programs.
The graduation rate metrics are calculated differently, depending on the program:
- For our first-time in college (FTIC) undergraduate students, we monitor the six-year (150%) and eight-year (200%) graduation rate. The eight-year graduation rate is the student completion indicator that we have selected for consideration by our institutional accreditor, the Southern Association of Colleges and Schools Commission on College (SACSCOC). Our institutional goal is to meet or exceed the median graduation rate of our identified set of 19 peer institutions. Additionally, we monitor the graduation rates of key groups of students based on demographic characteristics in order to target support and initiatives that enhance degree completion.
Cohort Year |
Peer median6-year grad rate |
EMU FTIC6-year grad rate |
Peer median8-year grad rate |
EMU FTIC8-year grad rate |
| 2013 | 54% | 58% | 54% | 59% |
| 2014 | 56% | 61% | 56% | 62% |
| 2015 | 59% | 55% | 60% | 56% |
| 2016 | 60% | 63% | 60% | 63% |
| 2017 | 57% | 47% | * | 47% |
| 2018 | 52% | 67% | * | * |
| 2019 | * | 60% | * | * |
*data not yet available
- For our graduate and non-traditional undergraduate programs, we monitor graduation rates in a program-specific way, often across time horizons longer than 150% of ŌĆ£standard time.ŌĆØ This approach acknowledges that many students in these programs pursue their studies part-time and are balancing a wide variety of personal considerations as they work toward completion. EMU prioritizes overall degree completion as our preferred metric, and works within a framework that is less concerned with ŌĆ£timelyŌĆØ completion. As such, our graduation rates for these programs are evaluated across a 6-year or 9-year horizon depending on whether program students are predominantly part-time. Limitations of external data available for benchmarking preclude establishing peer-based goals. As such, our goal is to maintain an overall, aggregate graduate and non-traditional program graduation rate of 80% or higher. This target represents a balanced understanding of both the focused intention common among graduate students (which might result in higher completion rates) and the realities that adult students in our programs face in balancing the competing priorities life often presents (many of our graduate students are working while studying part-time).
Cohort Year |
Grad & non-traditionalgraduation target |
Grad & non-traditionalgraduation rate |
| 2013 | 80% | 90% |
| 2014 | 80% | 92% |
| 2015 | 80% | 89% |
| 2016 | 80% | 88% |
| 2017 | 80% | 89% |
| 2018 | 80% | 90% |
- Detailed outcomes for Eastern Mennonite Seminary are posted on the Seminary Outcomes page.
Employment rate
Student Population: undergraduate students
Target: at or above the National Association of Colleges and Employers (NACE) Employed Overall rate for private, not for profit institutions. (NACE source - annual first destination survey)
EMUŌĆÖs employment rate is measured through a combination of surveys as well as data collected from departments on campus who may have knowledge of post-graduation activity of their program completers. Students are first invited to share their post-graduation outcomes through a survey completed at graduation. Program completers are sent a follow-up survey within their first post-graduation year.
Class Year |
NACE Overall Emplopyment Rate(private, not for profit) |
EMU's employment rate |
EMU knowledge rate |
| 2019 | 69% | 85% | 61% |
| 2020 | 64% | 84% | 61% |
| 2021 | 67% | 92% | 48% |
| 2022 | 68% | 83% | 63% |
| 2023 | 66% | 79% | 64% |
| 2024 | 65% | 84% | 70% |
| 2025 | * | * | * |
*data not yet available
Licensure and professional exam outcomes
Student Population: students in undergraduate programs that lead to licensure
Targets: established targets are program-specific:
- Nursing: NCLEX nursing licensure exam pass rate (traditional undergraduate nursing students) greater than 80%, which is required by the Commission on Collegiate Nursing Education (CCNE) and the Virginia Board of Nursing (see additional program outcome data)
- Teacher Education: 100% of teacher education program completers pass PRAXIS licensure exam (see additional CAEP program reporting measures)
Year |
NCLEX target |
NCLEX pass rate |
Praxis target |
Praxis pass rate* |
| 2019 | 80% | 84.9% | 100% | 100% |
| 2020 | 80% | 87.8% | 100% | 100% |
| 2021 | 80% | 81.8% | 100% | 100% |
| 2022 | 80% | 85.7% | 100% | 100% |
| 2023 | 80% | 90.0% | 100% | 100% |
| 2024 | 80% | 91.3% | 100% | 100% |
*Passing the Praxis exam is a teacher education program requirement